Hours of computing
It has been noted that the change in curriculum has been accompanied by a substantial decline in the number of hours of taught computing across key stages (Kemp and Berry 2019; Royal Society 2019). This section updates previous work and explores where the cut in hours has happened by looking at hours taught to individual year groups.
1 Overall
The hours taught has dropped across all key stages, but the drop has been most pronounced in KS4, which saw further decline between 2019/20 and 2022/23, now sitting at 43 % of the 2010 figure. There have been slight increases in KS3 and KS5 provision since 2019, with hours now sitting at 84 % and 76 % of their 2010 figures, respectively.
data
Total hours represents 70-80% of all state schools
Hours taught by year group show that the main drop KS3 hours appears to be the drop in year 9 provision, the final year of the key stage and sometimes the first year of GCSE provision. This suggests that a substantial explanation of the decline is due to the drop in three year GCSEs and other qualifications in computing. Previous reporting on overall KS3 figures (Kemp and Berry 2019; DfE 2019) hid this pattern.
data
Overall provision in a school of any computing lessons during the census period shows that 91 % of schools had some provision at KS3 in 2011, this had decreased to 78 % in 2019, and recovered slightly to 81 % in 2022. This might partly be explained by schools running carousel timetables, with computing timetabled for the spring rather than the summer. However, the substantial difference between 2011 and 2019 suggests a real decline in provision over that period.
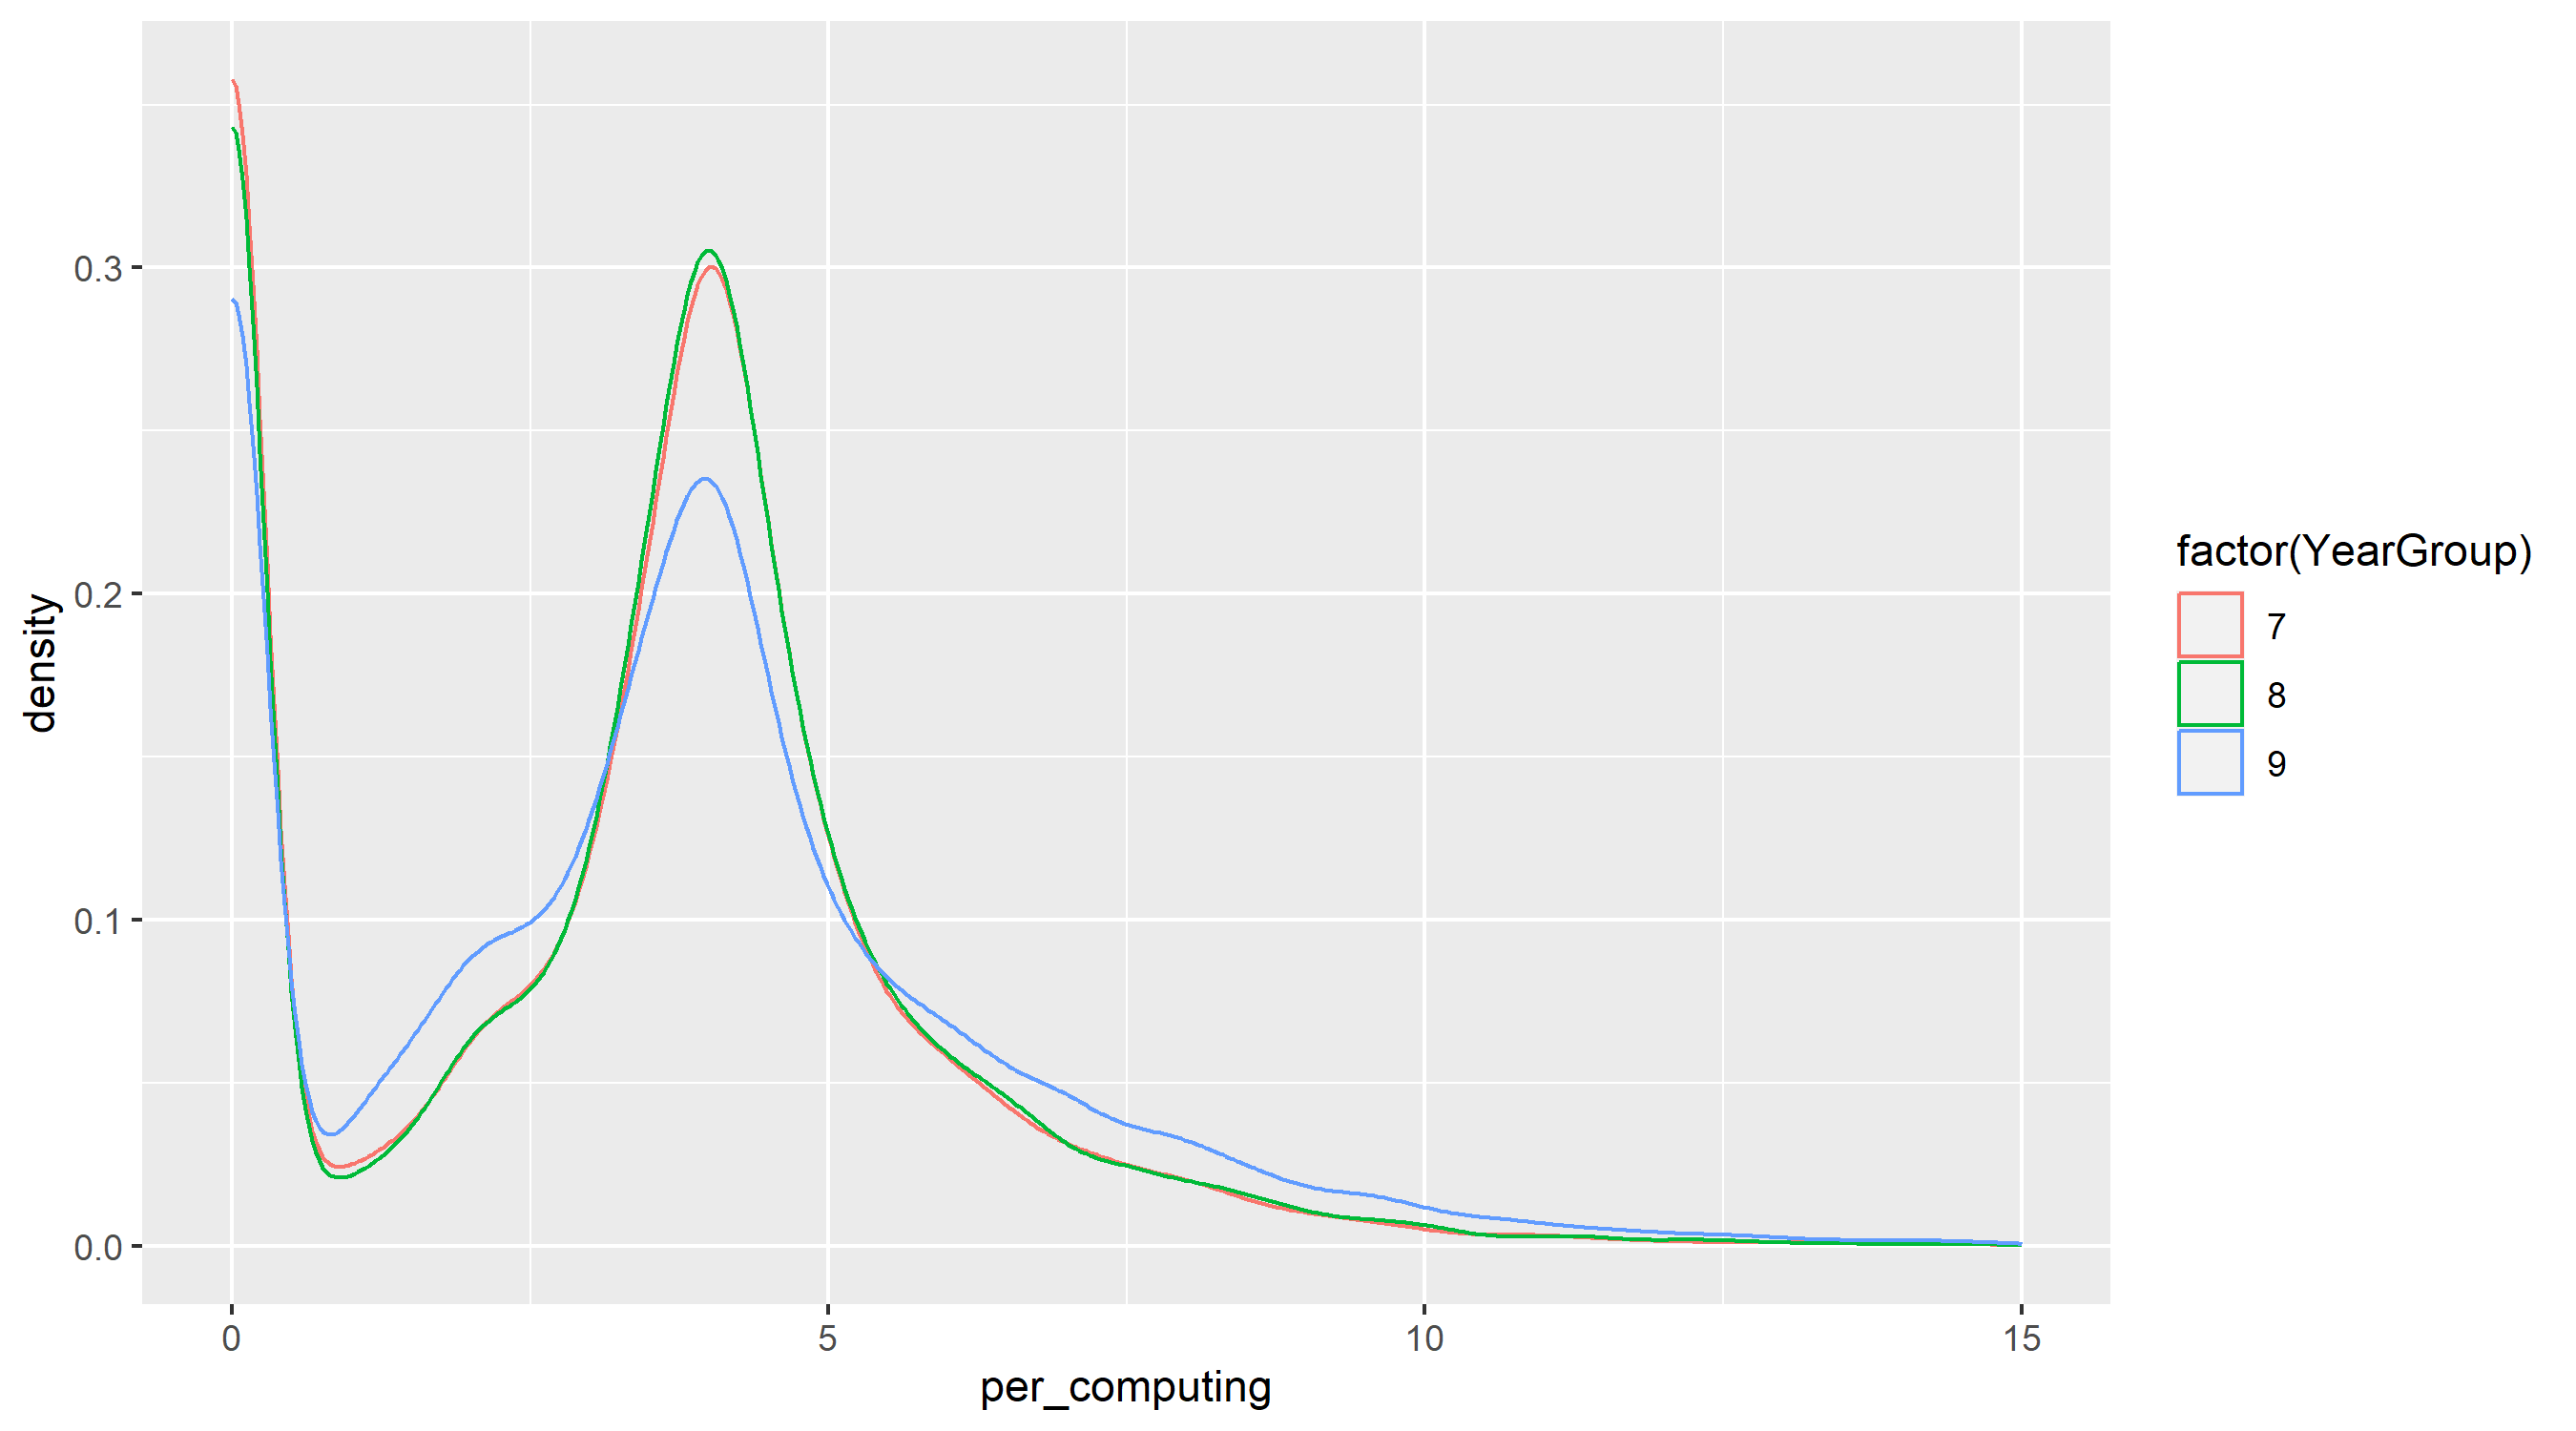
2 Key stage 3
The number of hours of computing as a percentage of a school’s timetable shows that the most common percentage was around 4 % of a weekly timetable, with another peak around 2 %. If the average weekly timetable is taken to be 25 teaching hours, 4 % equates to 1 hour a week, and 2 % to 30 minutes. Many schools offered no provision for this census period.
3 Gender
When we look at the distribution of the number of hours in a teacher’s timetable dedicated to teaching a subject, we see a substantial difference between male and female computing teachers and computing teachers and teachers of other subjects. Computing teachers typically have a lower proportion of their timetable dedicated to computing than teachers of other subjects. The median % of hours taught is ~74 % for males computing teachers and ~64 % for females, compared to ~100 % for maths and science teachers. There is a bunching of computing teachers around the 10 % timetable mark, more so than in the other comparison subjects, suggesting that many computing teachers are teaching other subjects as well, for the majority of their timetables.

References
DfE. 2019. “Statistics: School Workforce.” https://www.gov.uk/government/collections/statistics-school-workforce.
Kemp, Peter Edward Joseph, and Miles G Berry. 2019. “The Roehampton Annual Computing Education Report.” London, England: University of Roehampton. https://www.bcs.org/more/bcs-academy-of-computing/the-roehampton-annual-computing-education-report.
Royal Society. 2019. “Policy Briefing on Teachers of Computing - Recruitment, Retention and Development.” The Royal Society. https://royalsociety.org/-/media/policy/Publications/2019/21-08-19-policy-briefing-on-teachers-of-computing.pdf.