Computing qualifications
Computing is a broad subject encompassing skills and knowledge from computer science, information technology and digital literacy (Royal Society 2012). This section of the report focuses on the provision of computing qualifications in schools in England, this includes the GCSEs and A levels in computer science and ICT, as well as other qualifications in the digital skills landscape, selected from national data sets where the subject description included “ICT”, “IT”, “computing”, “computer science”, etc. Using this data we have constructed provision tables for the exam years 2011/12 - 2022/23, listing the number of schools offering each subject group, the number of exams taken (students could take multiple “Other Computing” exams), the number of classes provided and the average class size, where the maximum GCSE class size in a school is taken to be n=30, and for A level n=12, rounded up from 11.7 (Parish, Prime, and Day 2017). Additionally we provide the figures on “All computing” provision for each year, that is the number of providers offering any computing qualification in a given year.
A level provision for 2017-20 redacted student numbers for smaller providers, this makes class size and average cohort size hard to calculate for these years.
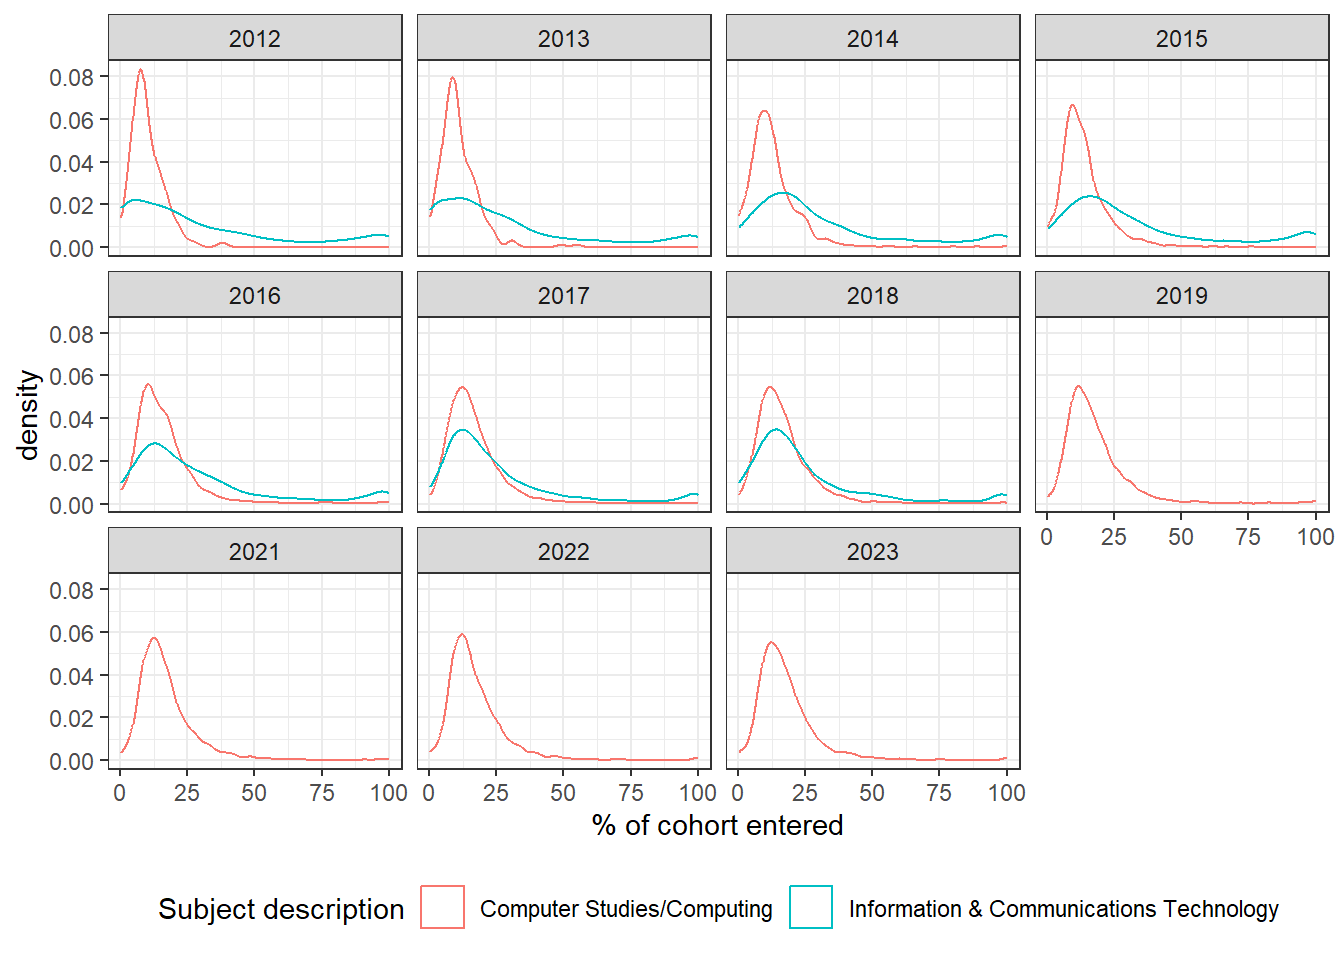
- GCSE computer science reach, being in 66.1 % of schools in 2022/23, is substantially above GCSE ICT reach, which peaked at 42.7 % of providers in 2014/15.
- typically, schools offering GCSE ICT had larger subject cohorts (an average of 2.2 classes per school, with 22.6 students in each class) than GCSE computer science (1.4 classes and 19.6 students per class)
- 77.1 % of schools offered key stage 4 exams in computing related qualifications in 2022/23, a steady rise since 2018/19, but down from a peak of 90.4 % in 2012/13.
- Other computing qualifications, often seen a not comparable to the GCSE qualifications (e.g. Thompson 2019), have declined sharply from a peak of 445,570 in 2012/13 to just 28,789 in 2022/23.
- the removal of the ICT GCSE in 2017/18 has coincided with an increase in entries of iMedia and Cambridge Nationals. Overall exam entries have remained relatively stable since 2018/19, with 160,567 entries in 2022/23.
- the average size of a GCSE computer science cohort has increased from
- computing related qualifications were offered at 74 % of key stage 5 providers in 2023, this is a decrease from 84 % of providers in 2014.
- whilst the number of A level computer science students have increased substantially, the number entering the AS level qualification have declined. Historically more students took the AS level than the A level.
A separate report looking into uptake of computing qualifications broken down by gender and poverty indicators can be found here.
1 KS4
| Subject | All computing | ||||||||
|---|---|---|---|---|---|---|---|---|---|
| schools | % | exams | classes | classes per school | avg class size | schools | % | ||
| 2023 | Computer Science | 3139 | 66.1% | 87,520 | 4,465 | 1.4 | 19.6 | 3665 | 77.1% |
| Other Computing | 935 | 19.7% | 28,789 | 1,550 | 1.4 | 18.6 | 3665 | 77.1% | |
| iMedia and Cambridge nationals | 1474 | 31.0% | 44,258 | 2,231 | 1.5 | 19.8 | 3665 | 77.1% | |
| 2022 | Computer Science | 2961 | 62.9% | 78,165 | 4,047 | 1.4 | 19.3 | 3556 | 75.5% |
| Other Computing | 948 | 20.1% | 32,298 | 1,703 | 1.5 | 19.0 | 3556 | 75.5% | |
| iMedia and Cambridge nationals | 1491 | 31.7% | 49,167 | 2,402 | 1.6 | 20.5 | 3556 | 75.5% | |
| 2021 | Computer Science | 2872 | 62.0% | 75,692 | 3,943 | 1.4 | 19.2 | 3463 | 74.7% |
| Other Computing | 946 | 20.4% | 32,917 | 1,699 | 1.5 | 19.4 | 3463 | 74.7% | |
| iMedia and Cambridge nationals | 1423 | 30.7% | 48,815 | 2,345 | 1.6 | 20.8 | 3463 | 74.7% | |
| 2019 | Computer Science | 2970 | 63.9% | 77,302 | 4,066 | 1.4 | 19.0 | 3458 | 74.4% |
| Other Computing | 1378 | 29.7% | 51,154 | 2,647 | 1.6 | 19.3 | 3458 | 74.4% | |
| iMedia and Cambridge nationals | 964 | 20.7% | 32,299 | 1,606 | 1.6 | 20.1 | 3458 | 74.4% | |
| 2018 | Computer Science | 2827 | 61.3% | 70,061 | 3,797 | 1.3 | 18.5 | 3639 | 78.9% |
| ICT | 1259 | 27.3% | 43,974 | 2,135 | 1.7 | 20.6 | 3639 | 78.9% | |
| Other Computing | 1533 | 33.2% | 54,833 | 3,043 | 1.5 | 18.0 | 3639 | 78.9% | |
| iMedia and Cambridge nationals | 694 | 15.0% | 20,394 | 1,068 | 1.5 | 19.1 | 3639 | 78.9% | |
| 2017 | Computer Science | 2686 | 58.5% | 68,992 | 3,672 | 1.4 | 18.8 | 3837 | 83.5% |
| ICT | 1703 | 37.1% | 60,957 | 2,964 | 1.7 | 20.6 | 3837 | 83.5% | |
| Other Computing | 2782 | 60.5% | 184,877 | 8,347 | 2.3 | 22.1 | 3837 | 83.5% | |
| iMedia and Cambridge nationals | 602 | 13.1% | 18,302 | 963 | 1.6 | 19.0 | 3837 | 83.5% | |
| 2016 | Computer Science | 2355 | 51.1% | 61,938 | 3,272 | 1.4 | 18.9 | 3748 | 81.3% |
| ICT | 1753 | 38.0% | 72,964 | 3,394 | 1.9 | 21.5 | 3748 | 81.3% | |
| Other Computing | 2562 | 55.6% | 171,104 | 8,151 | 2.0 | 21.0 | 3748 | 81.3% | |
| iMedia and Cambridge nationals | 890 | 19.3% | 39,386 | 1,837 | 2.1 | 21.4 | 3748 | 81.3% | |
| 2015 | Computer Science | 1446 | 31.7% | 33,492 | 1,862 | 1.3 | 18.0 | 3634 | 79.6% |
| ICT | 1947 | 42.7% | 100,467 | 4,437 | 2.2 | 22.6 | 3634 | 79.6% | |
| Other Computing | 2158 | 47.3% | 135,193 | 6,438 | 2.0 | 21.0 | 3634 | 79.6% | |
| iMedia and Cambridge nationals | 1080 | 23.7% | 67,249 | 2,853 | 2.6 | 23.6 | 3634 | 79.6% | |
| 2014 | Computer Science | 719 | 16.0% | 15,780 | 899 | 1.3 | 17.6 | 3410 | 75.9% |
| ICT | 1731 | 38.5% | 84,345 | 3,788 | 2.1 | 22.3 | 3410 | 75.9% | |
| Other Computing | 2476 | 55.1% | 162,690 | 7,694 | 2.0 | 21.1 | 3410 | 75.9% | |
| iMedia and Cambridge nationals | 7 | 0.2% | 68 | 7 | 1.0 | 9.7 | 3410 | 75.9% | |
| 2013 | Computer Science | 206 | 4.3% | 4,017 | 244 | 1.2 | 16.5 | 4287 | 90.4% |
| ICT | 1487 | 31.4% | 67,660 | 3,317 | 1.9 | 20.4 | 4287 | 90.4% | |
| Other Computing | 3950 | 83.3% | 445,570 | 23,979 | 1.8 | 18.6 | 4287 | 90.4% | |
| iMedia and Cambridge nationals | 122 | 2.6% | 1,458 | 152 | 1.2 | 9.6 | 4287 | 90.4% | |
| 2012 | Computer Science | 96 | 2.0% | 1,700 | 109 | 1.1 | 15.6 | 4128 | 87.8% |
| ICT | 1245 | 26.5% | 54,289 | 2,755 | 1.8 | 19.7 | 4128 | 87.8% | |
| Other Computing | 3721 | 79.1% | 287,621 | 17,430 | 1.5 | 16.5 | 4128 | 87.8% | |
| iMedia and Cambridge nationals | 242 | 5.1% | 2,193 | 370 | 1.1 | 5.9 | 4128 | 87.8% | |
| The maximum class size used for KS4 subjects is 30 | |||||||||

Steps of 4 years
| type | gender | schools | % cohort | classes | ||||
|---|---|---|---|---|---|---|---|---|
| 1 | 2 | 3 | 4 | 5 | ||||
| Comprehensive | Boys | 85 | 21.9% | 56.5% | 37.6% | 4.7% | 1.2% | — |
| Comprehensive | Girls | 115 | 11.2% | 89.6% | 10.4% | — | — | — |
| Comprehensive | Mixed | 2270 | 15.4% | 66.0% | 30.9% | 2.7% | 0.4% | — |
| Grammar | Boys | 53 | 34.0% | 15.1% | 60.4% | 18.9% | 3.8% | 1.9% |
| Grammar | Girls | 58 | 21.5% | 53.4% | 36.2% | 10.3% | — | — |
| Grammar | Mixed | 45 | 28.4% | 33.3% | 46.7% | 20.0% | — | — |
| Independent | Boys | 39 | 33.1% | 59.0% | 33.3% | 7.7% | — | — |
| Independent | Girls | 92 | 18.3% | 94.6% | 5.4% | — | — | — |
| Independent | Mixed | 317 | 19.3% | 89.0% | 10.7% | 0.3% | — | — |
| maxmimum class size 33 students | ||||||||
2 KS5
| Subject | All computing | ||||||||
|---|---|---|---|---|---|---|---|---|---|
| schools | % | exams | classes | classes per school | avg class size | schools | % | ||
| 2023 | Computer science A level | 1572 | 57.2% | 17,414 | 2,346 | 1.5 | 7.4 | 2021 | 73.6% |
| Computer science AS | 198 | 7.2% | 1,267 | 253 | 1.3 | 5.0 | 2021 | 73.6% | |
| Other Computing | 993 | 36.2% | 20,421 | 2,785 | 1.5 | 7.3 | 2021 | 73.6% | |
| 2022 | Computer science A level | 1488 | 54.4% | 14,863 | 2,085 | 1.4 | 7.1 | 1945 | 71.1% |
| Computer science AS | 173 | 6.3% | 1,037 | 213 | 1.2 | 4.9 | 1945 | 71.1% | |
| Other Computing | 994 | 36.3% | 20,957 | 2,808 | 1.6 | 7.5 | 1945 | 71.1% | |
| 2021 | Computer science A level | 1422 | 52.0% | 13,826 | 1,985 | 1.4 | 7.0 | 1884 | 68.9% |
| Other Computing | 944 | 34.5% | 17,769 | 2,220 | 1.7 | 8.0 | 1884 | 68.9% | |
| 2019 | Computer science A level | 1314 | 46.6% | 8,098 | - | - | - | 2073 | 73.5% |
| Computer science AS | 561 | 19.9% | 2,277 | - | - | - | 2073 | 73.5% | |
| ICT A level | 39 | 1.4% | 9 | - | - | - | 2073 | 73.5% | |
| ICT AS | 284 | 10.1% | 333 | - | - | - | 2073 | 73.5% | |
| ICT Applied | 59 | 2.1% | 34 | - | - | - | 2073 | 73.5% | |
| Other Computing | 1266 | 44.9% | 9,515 | - | - | - | 2073 | 73.5% | |
| 2018 | Computer science A level | 1225 | 42.8% | 7,246 | - | - | - | 2172 | 75.9% |
| Computer science AS | 836 | 29.2% | 5,071 | - | - | - | 2172 | 75.9% | |
| ICT A level | 436 | 15.2% | 3,247 | - | - | - | 2172 | 75.9% | |
| ICT AS | 549 | 19.2% | 6,117 | - | - | - | 2172 | 75.9% | |
| ICT Applied | 229 | 8.0% | 858 | - | - | - | 2172 | 75.9% | |
| Other Computing | 1187 | 41.5% | 11,341 | - | - | - | 2172 | 75.9% | |
| 2017 | Computer science A level | 1036 | 35.4% | 5,484 | - | - | - | 2391 | 81.8% |
| Computer science AS | 1055 | 36.1% | 8,969 | - | - | - | 2391 | 81.8% | |
| ICT A level | 614 | 21.0% | 4,219 | - | - | - | 2391 | 81.8% | |
| ICT AS | 726 | 24.8% | 9,080 | - | - | - | 2391 | 81.8% | |
| ICT Applied | 394 | 13.5% | 3,258 | - | - | - | 2391 | 81.8% | |
| Other Computing | 1425 | 48.7% | 19,030 | - | - | - | 2391 | 81.8% | |
| 2016 | Computer science A level | 833 | 28.0% | 5,433 | 983 | 1.2 | 5.5 | 2434 | 81.9% |
| Computer science AS | 1000 | 33.6% | 12,415 | 1,649 | 1.6 | 7.5 | 2434 | 81.9% | |
| ICT A level | 745 | 25.1% | 6,092 | 955 | 1.3 | 6.4 | 2434 | 81.9% | |
| ICT AS | 855 | 28.8% | 12,554 | 1,544 | 1.8 | 8.1 | 2434 | 81.9% | |
| ICT Applied | 517 | 17.4% | 10,799 | 1,468 | 1.5 | 7.4 | 2434 | 81.9% | |
| Other Computing | 1438 | 48.4% | 30,437 | - | - | - | 2434 | 81.9% | |
| 2015 | Computer science A level | 695 | 23.9% | 4,706 | 837 | 1.2 | 5.6 | 2418 | 83.3% |
| Computer science AS | 846 | 29.1% | 7,800 | 1,184 | 1.4 | 6.6 | 2418 | 83.3% | |
| ICT A level | 820 | 28.2% | 6,413 | 1,033 | 1.3 | 6.2 | 2418 | 83.3% | |
| ICT AS | 939 | 32.3% | 8,981 | 1,321 | 1.4 | 6.8 | 2418 | 83.3% | |
| ICT Applied | 621 | 21.4% | 10,381 | 1,605 | 1.3 | 6.5 | 2418 | 83.3% | |
| Other Computing | 1478 | 50.9% | 52,775 | 7,586 | 1.5 | 7.0 | 2418 | 83.3% | |
| 2014 | Computer science A level | 541 | 18.8% | 3,615 | 648 | 1.2 | 5.6 | 2386 | 83.1% |
| Computer science AS | 693 | 24.1% | 6,050 | 946 | 1.4 | 6.4 | 2386 | 83.1% | |
| ICT A level | 846 | 29.5% | 6,745 | 1,094 | 1.3 | 6.2 | 2386 | 83.1% | |
| ICT AS | 960 | 33.4% | 9,606 | 1,402 | 1.5 | 6.9 | 2386 | 83.1% | |
| ICT Applied | 739 | 25.7% | 12,961 | 1,937 | 1.4 | 6.7 | 2386 | 83.1% | |
| Other Computing | 1424 | 49.6% | 49,599 | 7,190 | 1.5 | 6.9 | 2386 | 83.1% | |
| 2013 | Computer science A level | 468 | 16.5% | 3,268 | 573 | 1.2 | 5.7 | 2380 | 84.1% |
| Computer science AS | 577 | 20.4% | 5,305 | 809 | 1.4 | 6.6 | 2380 | 84.1% | |
| ICT A level | 839 | 29.6% | 7,254 | 1,120 | 1.3 | 6.5 | 2380 | 84.1% | |
| ICT AS | 969 | 34.2% | 10,491 | 1,471 | 1.5 | 7.1 | 2380 | 84.1% | |
| ICT Applied | 804 | 28.4% | 16,516 | 2,327 | 1.5 | 7.1 | 2380 | 84.1% | |
| Other Computing | 1373 | 48.5% | 43,051 | 6,229 | 1.5 | 6.9 | 2380 | 84.1% | |
| 2012 | Computer science A level | 475 | 17.1% | 3,335 | 585 | 1.2 | 5.7 | 2342 | 84.4% |
| Computer science AS | 552 | 19.9% | 5,285 | 778 | 1.4 | 6.8 | 2342 | 84.4% | |
| ICT A level | 885 | 31.9% | 7,876 | 1,200 | 1.4 | 6.6 | 2342 | 84.4% | |
| ICT AS | 988 | 35.6% | 11,506 | 1,554 | 1.6 | 7.4 | 2342 | 84.4% | |
| ICT Applied | 863 | 31.1% | 18,127 | 2,479 | 1.5 | 7.3 | 2342 | 84.4% | |
| Other Computing | 1209 | 43.6% | 32,780 | 4,816 | 1.5 | 6.8 | 2342 | 84.4% | |
| The maximum class size used for KS5 subjects is 12 | |||||||||

Steps of 4 years 2018 redacted data? hence missing smaller values?

| type | gender | schools | % cohort | classes | |||||
|---|---|---|---|---|---|---|---|---|---|
| 1 | 2 | 3 | 4 | 5 | 6 | ||||
| Comprehensive | Boys | 51 | 8.3% | 96.1% | 2.0% | 2.0% | — | — | — |
| Comprehensive | Girls | 51 | 4.5% | 100.0% | — | — | — | — | — |
| Comprehensive | Mixed | 1198 | 3.7% | 93.3% | 4.5% | 1.3% | 0.7% | 0.1% | 0.1% |
| Comprehensive | — | 1 | 7.3% | 100.0% | — | — | — | — | — |
| Grammar | Boys | 59 | 9.5% | 88.1% | 10.2% | 1.7% | — | — | — |
| Grammar | Girls | 56 | 4.7% | 100.0% | — | — | — | — | — |
| Grammar | Mixed | 48 | 6.6% | 95.8% | 4.2% | — | — | — | — |
| Independent | Boys | 22 | 6.3% | 100.0% | — | — | — | — | — |
| Independent | Girls | 57 | 4.1% | 100.0% | — | — | — | — | — |
| Independent | Mixed | 227 | 5.6% | 100.0% | — | — | — | — | — |
| maxmimum class size 30 students | |||||||||