GCSE results comparison
1 Introduction
This short report provides data on the comparability of exam results in GCSE computer science compared to other exams taken in 2019 and 2020. Data is taken from the DfE’s national pupil database (NPD). The focus on these years is to give a picture of pre-pandemic difficulty versus the results given during the pandemic, allowing for the exploration of subject difficulty along with the impact of teacher allocated grades on female achievement in 2020 compared to exam only grades in 2019. Additionally, this will update work undertaken on the 2016 GCSE result set, a year when exam results in GCSE computer science included elements of assessed classroom based practicals and showed males and females performing poorly in the subject (Kemp, Wong, and Berry 2019; BCS 2021) - these non-exam elements have since been removed (Ofqual 2019). The approach taken involves Subject Pair Analysis, where the sets of results in subjects Y and X are compared against each other, but only where the student results are from students who sat exams in both subjects (Coe et al. 2008). The analysis here includes:
- the calculation of number and percentage of students who have results in subject Y which are either above, the same, or below their result in subject X.
- the same analysis broken down by student gender
In addition, the report covers descriptive data on the profile of students taking each qualification and subject pair, including, overall and by gender: - n: number of students in grouping - sub_mean: mean grade along with standard deviation for a given subject, X - other_mean: mean grade along with standard deviation for all other subjects taken - mean_diff: mean difference between grades X and all other subjects, along with standard deviation
Subject grades are given here using the numbers 0-9, where 9 is the highest grade possible, and 0 represents a fail. GCSE exams for 27 subjects in 2019 and 28 subjects in 2020 were included in the analysis. Subjects were excluded from the analysis as they were graded in 2019 using the older A-U grading system. Gender is provided by NPD’s school census, limited to Male and Female. Overall GCSE exam results are included, not the result of individual modules on a course. Subjects are only included where the GCSE had 10,000 or more entries in the given year. Where n <= 10 for a subject pair analysis comparison of subject Y and X, this data has been redacted.
Please note that where Computing is written below as this is the name recorded by the JCQ, this refers to the GCSE in computer science, an element of the computing curriculum (Royal Society 2012).
2 Results
3 grade profiles and outcomes of students by subject
For each subject with over 10,000 entries, the number of students entering the subject is recorded n, along with the mean grade in that subject sub_mean, the mean grade for the same students in other subjects other_mean and the mean difference diff_mean between a student’s mean grade and their grade in all the other GCSEs they took that year. This is repeated for each gender and standard deviations are included in brackets.
Table 3.1 shows that in 2019, a typical student taking computer science achieved 0.72 of a grade less in the exam than the average grade of their other subjects. The typical computer science female achieved 1.11 of grade less, compared to males, who achieved 0.63 of a grade less. For females this was the largest difference out of all qualifications taken, except for Statistics, where a typical female achieved 1.98 of a grade less. The grade difference for computer science for males was better than Statistics (-1.35), Psychology (-0.76), French (-0.80) and German (-0.93), and the same as Spanish (-0.63).
| qual_desc | n | sub_mean | other_mean | diff_mean | ||||||||
|---|---|---|---|---|---|---|---|---|---|---|---|---|
| ALL | Male | Female | ALL | Male | Female | ALL | Male | Female | ALL | Male | Female | |
| Biology | 161,749 | 75,455 | 73,083 | 6.12 (1.97) | 6.00 (1.97) | 6.20 (1.91) | 5.99 (1.65) | 5.78 (1.65) | 6.18 (1.56) | 0.13 (0.91) | 0.23 (0.90) | 0.02 (0.89) |
| Chemistry | 158,134 | 74,285 | 71,908 | 6.12 (1.97) | 6.02 (1.99) | 6.10 (1.94) | 6.10 (1.54) | 5.86 (1.55) | 6.26 (1.48) | 0.02 (1.01) | 0.16 (1.00) | -0.15 (0.98) |
| Physics | 157,121 | 74,121 | 71,688 | 6.13 (1.93) | 6.18 (1.97) | 5.99 (1.89) | 6.10 (1.54) | 5.84 (1.55) | 6.28 (1.48) | 0.03 (1.01) | 0.33 (0.97) | -0.29 (0.93) |
| Mathematics | 557,318 | 269,516 | 261,644 | 4.62 (2.13) | 4.63 (2.15) | 4.63 (2.06) | 4.50 (1.90) | 4.16 (1.87) | 4.85 (1.81) | 0.13 (1.23) | 0.49 (1.17) | -0.22 (1.16) |
| Statistics | 18,293 | 10,286 | 7,007 | 3.46 (2.76) | 3.54 (2.77) | 3.31 (2.69) | 5.06 (1.85) | 4.90 (1.85) | 5.29 (1.77) | -1.60 (2.53) | -1.35 (2.43) | -1.98 (2.59) |
| Computing | 77,636 | 58,117 | 15,450 | 4.46 (2.34) | 4.36 (2.32) | 4.58 (2.36) | 5.18 (1.76) | 4.98 (1.72) | 5.70 (1.72) | -0.72 (1.29) | -0.63 (1.28) | -1.11 (1.24) |
| Business | 88,200 | 49,869 | 34,065 | 4.54 (2.11) | 4.40 (2.09) | 4.68 (2.12) | 4.78 (1.64) | 4.56 (1.63) | 5.04 (1.58) | -0.24 (1.17) | -0.16 (1.12) | -0.35 (1.19) |
| Art & Design | 60,060 | 17,271 | 38,039 | 4.90 (2.01) | 3.96 (1.81) | 5.20 (1.90) | 4.45 (1.90) | 3.76 (1.85) | 4.64 (1.78) | 0.47 (1.56) | 0.22 (1.58) | 0.57 (1.52) |
| Photography | 31,190 | 11,892 | 17,969 | 4.93 (1.92) | 4.32 (1.81) | 5.27 (1.85) | 3.98 (1.65) | 3.56 (1.59) | 4.21 (1.60) | 0.95 (1.57) | 0.76 (1.62) | 1.07 (1.51) |
| Fine Art | 66,860 | 18,180 | 41,680 | 5.15 (2.04) | 4.18 (1.86) | 5.35 (1.92) | 4.72 (1.92) | 3.98 (1.85) | 4.83 (1.78) | 0.43 (1.57) | 0.21 (1.58) | 0.52 (1.54) |
| Geography | 251,763 | 126,487 | 108,565 | 4.71 (2.29) | 4.37 (2.24) | 4.84 (2.26) | 4.87 (1.80) | 4.52 (1.76) | 5.07 (1.71) | -0.16 (1.05) | -0.15 (1.02) | -0.23 (1.05) |
| History | 262,501 | 119,121 | 133,150 | 4.60 (2.40) | 4.29 (2.37) | 4.80 (2.37) | 4.89 (1.74) | 4.57 (1.74) | 5.11 (1.67) | -0.29 (1.25) | -0.28 (1.24) | -0.31 (1.25) |
| Religious Studies | 226,219 | 97,081 | 114,403 | 5.12 (2.32) | 4.48 (2.25) | 5.49 (2.24) | 4.96 (1.79) | 4.61 (1.78) | 5.10 (1.71) | 0.16 (1.33) | -0.14 (1.30) | 0.38 (1.29) |
| Psychology | 14,588 | 4,178 | 9,723 | 4.35 (2.29) | 3.82 (2.18) | 4.60 (2.28) | 5.10 (1.59) | 4.88 (1.59) | 5.21 (1.55) | -0.76 (1.38) | -1.06 (1.27) | -0.61 (1.35) |
| Sociology | 20,898 | 5,810 | 14,713 | 4.44 (2.20) | 3.87 (2.10) | 4.70 (2.18) | 4.78 (1.63) | 4.42 (1.64) | 4.94 (1.59) | -0.34 (1.28) | -0.55 (1.21) | -0.24 (1.28) |
| Social Science: Citizenship | 18,861 | 8,020 | 9,247 | 4.33 (2.20) | 3.98 (2.16) | 4.65 (2.13) | 4.29 (1.77) | 4.03 (1.74) | 4.55 (1.72) | 0.05 (1.24) | -0.05 (1.24) | 0.10 (1.22) |
| English Lang | 561,774 | 268,404 | 261,430 | 4.70 (1.93) | 4.30 (1.87) | 5.07 (1.86) | 4.51 (1.94) | 4.21 (1.90) | 4.76 (1.85) | 0.19 (1.08) | 0.09 (1.06) | 0.31 (1.06) |
| English Lit | 545,932 | 263,122 | 258,780 | 4.80 (2.04) | 4.34 (1.99) | 5.19 (1.96) | 4.56 (1.88) | 4.26 (1.85) | 4.78 (1.81) | 0.24 (1.12) | 0.09 (1.12) | 0.42 (1.09) |
| Drama & Theatre | 57,916 | 18,267 | 33,379 | 5.04 (2.04) | 4.23 (1.90) | 5.21 (1.94) | 4.95 (1.79) | 4.41 (1.76) | 5.03 (1.69) | 0.08 (1.29) | -0.17 (1.25) | 0.18 (1.27) |
| Media Studies | 31,503 | 16,535 | 14,298 | 4.44 (2.14) | 3.91 (1.98) | 5.04 (2.15) | 4.35 (1.60) | 4.03 (1.55) | 4.70 (1.58) | 0.09 (1.38) | -0.13 (1.32) | 0.34 (1.40) |
| French | 124,471 | 48,979 | 67,765 | 4.79 (2.11) | 4.40 (2.07) | 4.92 (2.06) | 5.59 (1.68) | 5.36 (1.71) | 5.64 (1.63) | -0.80 (1.52) | -0.96 (1.54) | -0.72 (1.47) |
| German | 41,846 | 19,103 | 20,102 | 4.97 (2.04) | 4.68 (2.00) | 5.09 (1.98) | 5.90 (1.64) | 5.73 (1.67) | 5.96 (1.59) | -0.93 (1.47) | -1.05 (1.44) | -0.88 (1.41) |
| Spanish | 99,571 | 39,253 | 53,208 | 4.86 (2.23) | 4.45 (2.18) | 5.00 (2.18) | 5.49 (1.69) | 5.23 (1.71) | 5.54 (1.62) | -0.63 (1.78) | -0.78 (1.83) | -0.54 (1.72) |
| Music | 34,763 | 13,937 | 16,861 | 5.31 (2.20) | 4.98 (2.22) | 5.23 (2.10) | 5.54 (1.86) | 5.18 (1.91) | 5.60 (1.75) | -0.24 (1.55) | -0.20 (1.56) | -0.38 (1.50) |
| Physical Ed | 79,735 | 47,146 | 26,500 | 4.95 (1.93) | 4.67 (1.84) | 5.22 (1.97) | 4.84 (1.67) | 4.48 (1.63) | 5.30 (1.57) | 0.11 (1.18) | 0.19 (1.12) | -0.08 (1.23) |
| Design & Tech | 88,461 | 57,081 | 24,488 | 4.53 (2.16) | 4.09 (2.04) | 5.04 (2.12) | 4.52 (1.83) | 4.17 (1.74) | 4.93 (1.74) | 0.00 (1.26) | -0.08 (1.24) | 0.10 (1.23) |
| D&T Food | 45,236 | 16,473 | 26,595 | 4.54 (2.02) | 3.74 (1.77) | 4.92 (1.98) | 4.17 (1.73) | 3.64 (1.62) | 4.40 (1.68) | 0.37 (1.14) | 0.10 (1.11) | 0.52 (1.12) |
| data from the national pupil database | ||||||||||||
If exams were favouring females in other subjects, then the shift to teacher allocated grades during the pandemic might see better results. Table 3.2 shows that in 2020, a typical student taking computer science achieved 0.37 of a grade less in the exam than the average grade of their other subjects, this was an improvement on the year before, when it was -0.72. The typical computer science female had their grade difference from other exams nearly halved from -1.11 to -0.62, with a similar picture for males, who achieved -0.30, down from -0.63. However, for females this was again the largest difference out of all qualifications except for Statistics (-0.67). The score for males was only better than Sociology (-0.31), Psychology (-0.55), French (-0.82), German (-0.81) and Spanish (-0.65).
| qual_desc | n | sub_mean | other_mean | diff_mean | ||||||||
|---|---|---|---|---|---|---|---|---|---|---|---|---|
| ALL | Male | Female | ALL | Male | Female | ALL | Male | Female | ALL | Male | Female | |
| Biology | 161,577 | 75,145 | 73,241 | 6.59 (1.78) | 6.44 (1.79) | 6.68 (1.72) | 6.51 (1.54) | 6.28 (1.56) | 6.68 (1.45) | 0.08 (0.86) | 0.16 (0.86) | 0.00 (0.84) |
| Chemistry | 157,529 | 73,626 | 72,137 | 6.59 (1.74) | 6.48 (1.76) | 6.57 (1.71) | 6.61 (1.44) | 6.36 (1.46) | 6.75 (1.38) | -0.02 (0.89) | 0.12 (0.89) | -0.18 (0.88) |
| Physics | 156,831 | 73,601 | 71,928 | 6.59 (1.71) | 6.60 (1.75) | 6.48 (1.68) | 6.61 (1.44) | 6.35 (1.46) | 6.77 (1.38) | -0.02 (0.91) | 0.25 (0.89) | -0.29 (0.86) |
| Mathematics | 575,984 | 279,968 | 271,287 | 4.96 (2.07) | 4.94 (2.10) | 4.99 (2.00) | 5.01 (1.84) | 4.66 (1.81) | 5.35 (1.76) | -0.04 (1.15) | 0.29 (1.10) | -0.36 (1.08) |
| Statistics | 23,431 | 13,090 | 9,498 | 5.07 (2.02) | 5.08 (2.06) | 5.01 (1.93) | 5.48 (1.78) | 5.30 (1.79) | 5.69 (1.70) | -0.41 (1.12) | -0.21 (1.11) | -0.67 (1.08) |
| Computing | 76,234 | 56,662 | 15,060 | 5.40 (2.18) | 5.24 (2.17) | 5.66 (2.16) | 5.76 (1.71) | 5.54 (1.66) | 6.28 (1.65) | -0.37 (1.20) | -0.30 (1.21) | -0.62 (1.14) |
| Business | 91,162 | 51,390 | 34,949 | 5.27 (2.00) | 5.07 (1.98) | 5.44 (2.00) | 5.26 (1.58) | 5.01 (1.57) | 5.51 (1.53) | 0.01 (1.08) | 0.06 (1.07) | -0.07 (1.08) |
| Art & Design | 60,337 | 17,720 | 38,253 | 5.40 (1.88) | 4.49 (1.71) | 5.69 (1.76) | 4.93 (1.85) | 4.23 (1.77) | 5.11 (1.75) | 0.48 (1.43) | 0.28 (1.45) | 0.59 (1.39) |
| Photography | 36,095 | 13,823 | 20,737 | 5.40 (1.76) | 4.78 (1.63) | 5.74 (1.69) | 4.47 (1.63) | 4.01 (1.55) | 4.70 (1.58) | 0.93 (1.40) | 0.77 (1.43) | 1.04 (1.36) |
| Art & Design (Textiles) | 10,838 | 587 | 9,297 | 5.57 (1.84) | 4.12 (1.61) | 5.51 (1.76) | 5.07 (1.74) | 3.60 (1.52) | 5.01 (1.66) | 0.50 (1.41) | 0.51 (1.51) | 0.50 (1.41) |
| Fine Art | 68,741 | 18,794 | 43,160 | 5.65 (1.90) | 4.68 (1.74) | 5.84 (1.78) | 5.17 (1.88) | 4.43 (1.80) | 5.26 (1.76) | 0.48 (1.42) | 0.26 (1.45) | 0.59 (1.39) |
| Geography | 256,545 | 129,898 | 111,096 | 5.19 (2.18) | 4.88 (2.13) | 5.31 (2.16) | 5.31 (1.75) | 4.96 (1.71) | 5.50 (1.66) | -0.12 (1.02) | -0.08 (1.01) | -0.19 (1.02) |
| History | 275,135 | 126,208 | 139,100 | 5.11 (2.22) | 4.82 (2.19) | 5.29 (2.21) | 5.33 (1.70) | 5.00 (1.70) | 5.55 (1.63) | -0.22 (1.12) | -0.18 (1.12) | -0.26 (1.13) |
| Religious Studies | 225,230 | 97,136 | 114,151 | 5.47 (2.18) | 4.87 (2.13) | 5.78 (2.11) | 5.42 (1.74) | 5.06 (1.72) | 5.55 (1.66) | 0.05 (1.22) | -0.19 (1.23) | 0.23 (1.20) |
| Psychology | 14,649 | 4,144 | 9,779 | 5.31 (2.10) | 4.82 (2.05) | 5.51 (2.05) | 5.64 (1.58) | 5.37 (1.58) | 5.74 (1.53) | -0.33 (1.12) | -0.55 (1.10) | -0.23 (1.09) |
| Sociology | 21,806 | 6,225 | 15,264 | 5.12 (2.03) | 4.54 (1.95) | 5.38 (1.99) | 5.23 (1.55) | 4.85 (1.54) | 5.41 (1.51) | -0.12 (1.11) | -0.31 (1.09) | -0.03 (1.10) |
| Social Science: Citizenship | 20,477 | 9,011 | 10,016 | 4.81 (2.08) | 4.39 (2.05) | 5.13 (2.00) | 4.81 (1.75) | 4.43 (1.72) | 5.09 (1.68) | 0.00 (1.18) | -0.05 (1.20) | 0.04 (1.16) |
| English Lang | 581,108 | 278,986 | 271,160 | 5.11 (1.88) | 4.71 (1.81) | 5.47 (1.82) | 5.01 (1.88) | 4.70 (1.84) | 5.25 (1.79) | 0.11 (0.94) | 0.01 (0.92) | 0.23 (0.92) |
| English Lit | 563,881 | 273,060 | 268,003 | 5.09 (1.96) | 4.64 (1.90) | 5.46 (1.90) | 5.08 (1.82) | 4.77 (1.79) | 5.29 (1.75) | 0.01 (0.96) | -0.13 (0.95) | 0.17 (0.93) |
| Drama & Theatre | 58,096 | 18,205 | 33,431 | 5.77 (1.93) | 5.00 (1.87) | 5.91 (1.83) | 5.46 (1.73) | 4.89 (1.71) | 5.51 (1.63) | 0.31 (1.16) | 0.12 (1.18) | 0.41 (1.14) |
| Media Studies | 29,167 | 14,986 | 13,634 | 5.18 (1.89) | 4.67 (1.77) | 5.70 (1.85) | 4.82 (1.57) | 4.47 (1.52) | 5.16 (1.53) | 0.37 (1.09) | 0.20 (1.06) | 0.55 (1.08) |
| French | 124,988 | 49,237 | 68,314 | 5.38 (1.98) | 4.97 (1.97) | 5.52 (1.92) | 6.04 (1.61) | 5.79 (1.64) | 6.10 (1.55) | -0.66 (1.31) | -0.82 (1.36) | -0.58 (1.26) |
| German | 40,862 | 18,594 | 19,771 | 5.67 (1.93) | 5.33 (1.92) | 5.81 (1.86) | 6.32 (1.57) | 6.14 (1.60) | 6.37 (1.51) | -0.66 (1.24) | -0.81 (1.25) | -0.56 (1.17) |
| Spanish | 104,837 | 41,808 | 55,798 | 5.46 (2.06) | 5.01 (2.05) | 5.62 (2.00) | 5.95 (1.62) | 5.66 (1.63) | 6.01 (1.56) | -0.50 (1.54) | -0.65 (1.63) | -0.39 (1.49) |
| Music | 34,701 | 14,107 | 16,473 | 6.13 (1.99) | 5.75 (2.03) | 6.10 (1.91) | 5.99 (1.79) | 5.56 (1.82) | 6.06 (1.68) | 0.13 (1.29) | 0.20 (1.35) | 0.04 (1.26) |
| Physical Ed | 73,986 | 42,555 | 25,175 | 5.64 (1.91) | 5.30 (1.83) | 5.94 (1.93) | 5.39 (1.58) | 5.02 (1.54) | 5.79 (1.49) | 0.24 (1.12) | 0.28 (1.09) | 0.15 (1.16) |
| Design & Tech | 89,009 | 58,106 | 23,840 | 5.21 (2.02) | 4.77 (1.90) | 5.76 (1.97) | 4.99 (1.77) | 4.62 (1.68) | 5.41 (1.68) | 0.21 (1.17) | 0.15 (1.18) | 0.36 (1.15) |
| D&T Food | 47,334 | 17,766 | 27,365 | 5.11 (1.94) | 4.40 (1.76) | 5.45 (1.88) | 4.61 (1.68) | 4.13 (1.58) | 4.81 (1.64) | 0.50 (1.10) | 0.27 (1.10) | 0.64 (1.07) |
| data from the national pupil database | ||||||||||||
4 Heat maps
The following plots record the outcomes of subject pair analysis across a range of GCSE exams. Graphs provide data on whether males and females achieved grades in subject X above or below their grade in subject Y, when both exams were taken in the same exam year. Grades for getting the same result are not provided, but can be calculated from the data below.
Reading across the “above” graphs you can see in the percentage of students in the y-axis subject who achieved a higher grade in that subject than in the x-axis subject. For example, in Figure 5.1 we can see that 10 % of females sitting computer science and biology at the same time achieved a higher grade in computer science (the red square, below).
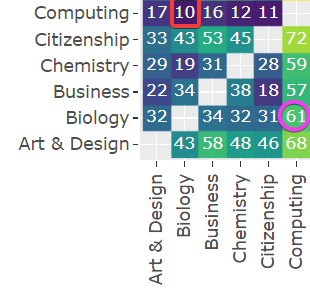
Reading from top to bottom, we can look at the opposite, i.e. 61 % females achieved a higher grade in biology when also taking computer science (the purple circle, above). Using this data we can start to get an understanding about student perceptions of the relative difficulty of subjects, in this case females might feel justified in thinking that they are better at biology than computer science. This might impact student self-efficacy and given a free choice be more likely to follow educational and career paths that relate to biology (Kemp, Wong, and Berry 2019).
5 2019
Looking at Figure 5.1 we can see that very few females taking computer science achieved a higher grade in CS than in Mathematics (6 %), Food Technology (6 %) and Photography (9 %). When taking Statistics (40 %), languages and music (30 %) females saw better performance. Males had a similar grade difference profile to females with mathematics (Figure 5.2), with only 7 % getting a better grade in CS, the picture elsewhere was better than for females. 83% of females taking Photography and 81% of those taking Food Technology got a grade or more lower in CS than in those subjects (Figure 5.3). For males, mathematics saw 74% of students getting a lower score in computer science, females also had 74% below (Figure 5.4).
6 2020
The average grade difference decreased between 2019 and 2020, that followed the introduction of teacher assessed grades (see (dfeannouncement?)) would suggest that the percentage of females and males getting grades in other subjects below computer science should decrease between these years. Looking at the Figure 6.3 we can see that for females the percentage of students getting a lower grade in CS than another subject saw the biggest figure remaining for Photography, but with the percentage dropping to 70%. For males, mathematics retained the highest percentage, but this also dropped, to 58%. Additionally, the percentage of females getting a higher grade in CS than in maths increased to 15%, and Food Technology increased to 11%. For males the percentage getting a higher grade in CS than in maths increased to 14%.
7 Limitations
- exams listed only report the final exam result in the range 0-9, this is a crude measure of outcome, hiding the strengths that might students might present in certain aspects of the subject and any sub-level performance, e.g. students being a strong grade 6 or a weak grade 6
- courses with smaller cohorts have been excluded, these might have shown differences in excess of those demonstrated above
- only GCSE results are looked at here, other qualifications might have shown different patterns
- data here only covers 2019 and 2020. The pattern seen in subsequent years also needs to be explored.
- there are problems with subject pair analysis (e.g. see Coe et al. 2008), for example other demographic information of students such as poverty is not included here; for subjects where student ability is generally stronger, grades will bunch towards the higher end of the outcomes and more grades will be equal rather than below or above. Other models subject comparability models should be explored.
8 Conclusion
This report helps demonstrate the perceived difficulty of the GCSE computer science subject:
- GCSE computer science exams in 2019 were amongst the most difficult exams for students to achieve well in when compared to their results in other subjects
- Females, typically, performed badly at GCSE computer science, achieving on average 1.11 of a grade less in the subject in 2019 when compared to other subjects they were taking. The grade difference was also present for males, but less substantial at -0.63.
- The shift to teacher assessed grades in 2020 appears to have resulted in females being awarded computer grades closer to their performance in other subjects, however, they still underperform when compared to most other subjects.
9 Acknowledgements
- The English Department of Education’s National Pupil Database team provided the data for this report.
- This work contains statistical data from ONS which is Crown Copyright. The use of the ONS statistical data in this work does not imply the endorsement of the ONS in relation to the interpretation or analysis of the statistical data. This work uses research data sets which may not exactly reproduce National Statistics aggregates.
- The analysis was carried out in the Secure Research Service, part of the Office for National Statistics.
- All responsibility for clarity, inferences and conclusions in this report lie with its authors.